Learn how to turn tight cybersecurity budgets into board-ready, data-driven roadmaps. The article explains why traditional ROI fails, shows how Cyber Heat Map prioritizes high-impact gaps with peer benchmarks, and outlines how Cyber Heat Map® transforms technical needs into business value executives support.
Traditional ROI math falls apart in cybersecurity. When a CISO spends $300,000 on a next-gen firewall and nothing bad happens, the “return” remains invisible.
Boards see marketing proposals backed by revenue forecasts. HR shows talent acquisition metrics. Product teams project sales growth.
Yet security leaders present line items promising only the absence of headlines.
This fundamental disconnect creates budget friction when resources are already tight. Forrester’s 2024 benchmark puts the median cybersecurity allocation at just 5.7 percent of total tech budgets, while IANS Research found that 12 percent of CISOs saw their budgets cut in 2024 (IANS Research).
When money is that tight, every additional dollar demands proof.
Because “nothing happened” falls flat, security leaders may resort to weak tactics: fear narratives, compliance mandates, or vendor hype. Each approach creates problems.
Fear tactics trigger defensive reactions rather than strategic thinking. Compliance checklists create endless to-do lists without addressing actual risk. Vendor promises rarely align with organizational priorities.
The real challenge lies in translating abstract risk into prioritized business outcomes the board can grasp.
A community college CIO who worked with Cyber Heat Map transformed this dynamic. When compliance checklists dominated his board meetings, he ran a capability assessment that compared his program to similar institutions.
The assessment and planning tools highlighted five areas needing improvement: multi-factor authentication, privileged access management, incident playbooks, improving disaster recovery, and strengthening staff security awareness training.
With peer data and a one-page roadmap, he reframed his budget request from “We risk non-compliance” to “Here is where our limited dollars will cut the most business risk.” Trustees approved his plan even though overall spending remained flat.
Why did this work? The board saw numbers, not anecdotes or vague color-coded risk dashboards.
Executives care about three fundamental questions when reviewing cybersecurity investments:
1. How do we compare? A benchmark report gives directors instant context. Stating “we are below average versus similar organizations” taps into their instinct to measure performance against peers.
2. What will change? Boards respond when each proposed project connects to specific risk reduction. Showing how “these five initiatives eliminate our highest-exposure gaps” transforms abstract threats into a business case.
3. How will we prove it? Trend lines for familiar operational KPIs show progress. Using tools like Cyber Heat Map helps you show trends and benchmark scores. You can also show a concise dashboard showing trends for metrics like Mean Time to Detect (MTTD), Mean Time to Respond (MTTR), and patch cadence that mirror metrics highlighted in boardroom primers.
These three data points, peer rank, risk-per-project impact, and KPI trends, translate technical findings into the concise, numbers-driven story boards expect.
Not all benchmarks deliver equal value. Effective cybersecurity comparisons should be “board-relevant, statistically credible, and threat-aligned.”
Start with your own industry vertical. Attack patterns differ sharply across sectors. Verizon’s DBIR notes that “what keeps one industry tossing and turning at night may not even register as a blip on another’s radar” (Verizon DBIR).
Next, slice by organizational size and operating model so resource realities and control maturity align. A community college with 5,000 students faces is quite a bit different from a research university with 50,000.
Cyber Heat Map achieves this granularity by pooling anonymized assessment results to show how each user’s results compare to other similar organizations.
The result? Simple benchmark scores showing if your capabilities are above or below similar organizations and trend lines that show boards how these scores have changed. This helps frame conversations about where budget should go next and how you compare to peers rather than describing arbitrary “best practices.”
The most effective budget presentations follow a clear, linear flow that keeps the conversation strategic and evidence-based.
Start with progress. Open with a concise, one-slide recap of last year’s spend and the improvements it delivered. Show trend lines for your overall capability score and one or two board-familiar KPIs, such as Mean Time to Respond (MTTR).
Identify your top priority gaps. Pivot to today’s top security gaps. Anchor each with benchmark data comparing your capability levels and a plain-English risk explanation: “Our capability score for privileged access management is significantly below similar organizations” showing the benchmark scores for this capability. Then explain how “lateral movement remains a high-probability breach path.”
Present the investment request. For each project, pair purchase cost, internal labor hours, and timeline with the specific risk or compliance exposure it will close. Translate this into risk reduction versus cost and effort to show diligence. (Or use a tool like Cyber Heat Map that provides automatic priority scoring for each potential project.)
Share the roadmap. Following Gartner’s framework, you can outline a 12-24 month plan that shows current state, target state, and key milestones. This shows executives when each metric will improve.
Confirm accountability. Finish by identifying owners, reporting cadence, and how updates will map back to the same scorecard metrics you opened with.
Boards don’t care about packet counts or vulnerability IDs. They care about business outcomes.
Rephrase each technical requirement using the vocabulary directors already monitor: financial impact, operational continuity, regulatory exposure, and reputation.
Rather than stating “We blocked 1.2 million intrusion attempts,” try “Our new denial-of-service controls prevented an attack that would have shut down online enrollment at its busiest time.”
Ground the cost of inaction in widely cited figures. IBM’s 2024 report shows an average breach cost of $4.88 million (IBM Data Breach Report).
Cyber Heat Map embeds this translation throughout its improvement recommendations and planning tools. Each gap receives a 0-to-100 priority score that blends risk mitigation value, compliance relevance, and synergy with adjacent controls.
Peer adoption data shows where comparable organizations have already acted, allowing security leaders to say, “We are in the bottom quartile for privileged-access monitoring, a critical safeguard against server compromise. It carries an internal priority score of 100, and fewer than 30 percent of our peers are still at our level of adoption.”
This approach places security alongside marketing, finance, and facilities in the investment discussion using familiar business language rather than tech jargon.
When resources are scarce, start with a capability-first lens instead of a compliance checklist. Cyber Heat Map follows a four-layer maturity model for every capability (Prevention, Detection, Investigation, Mitigation) that guides leaders to invest where they create the most resilience as their security team’s capabilities grow.
Prevention covers capabilities that help stop bad things from happening. This foundation covers “traditional” cybersecurity capabilities, like antivirus, firewalls, and more.
Detection capabilities detect and contain the attacks that slip through prevention, such as tools that analyze log files for anomalies and other evidence of attacker behavior. Using analytics and machine learning (or AI), these tools identify potentially suspicious but seemingly harmless activity.
Investigation enhancements boost efficiency but rely on a solid core. This is where teams leverage tools with greater threat hunting and evidence collection and analysis. This enables them to look beyond an alert to understand the potential scope and impact of an attack.
Mitigation covers capabilities that shift the team to a more proactive stance. Prevention tools also help mitigate potential risks, but mitigation capabilities are more advanced solutions that help teams leverage the underlying layers to refine the program even further. Activities like threat intelligence analysis, blue teams to analyze security control effectiveness, and proactive workflow and automation tools fall into this bucket.
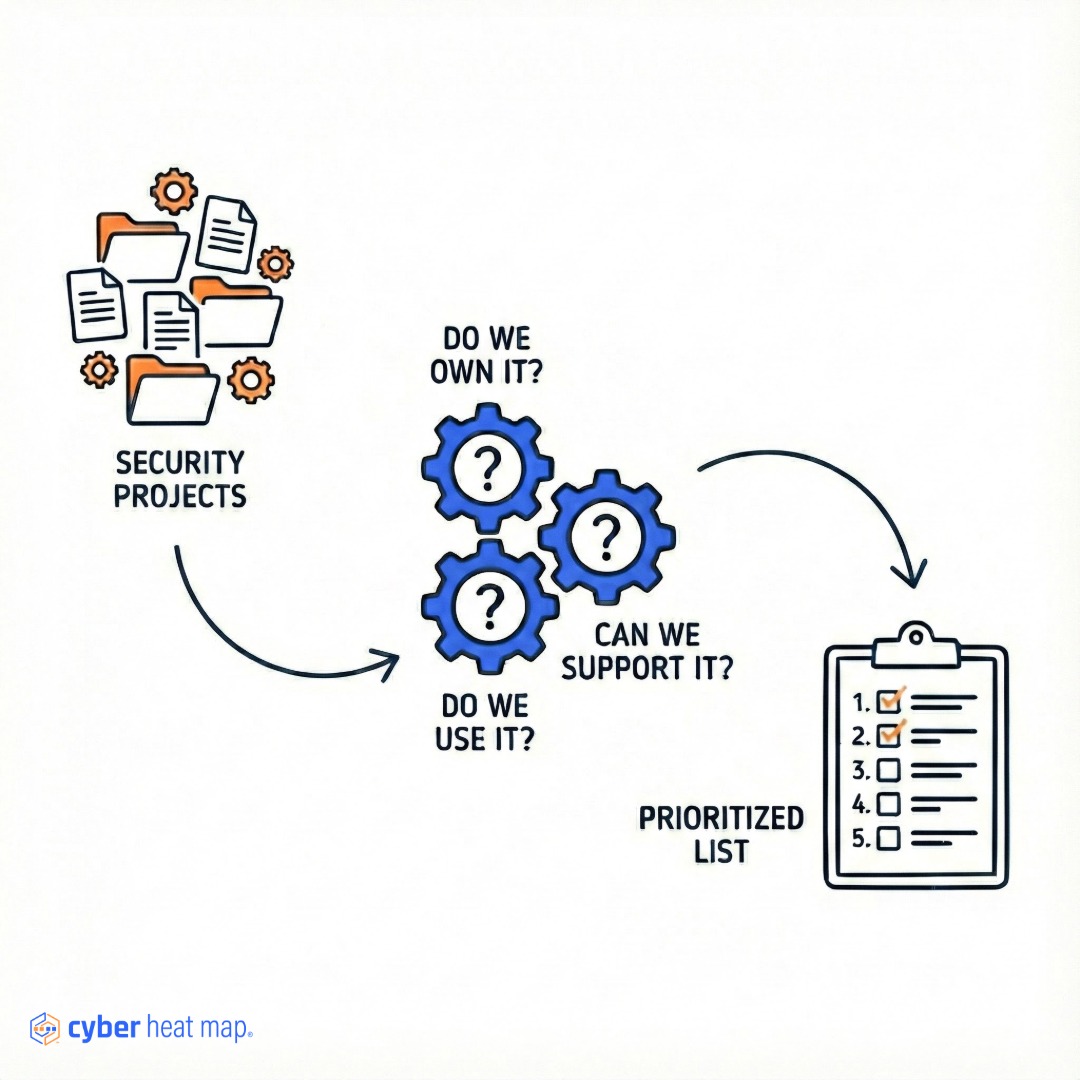
Cyber Heat Map automates this triage by assigning a 0-to-100 priority score to each gap. The score weighs four factors: risk reduction, compliance relevance, dependency support (does this control unlock others), and resource readiness (do you already own tooling or skills).
Because the algorithm also compares your scores to peer adoption rates, you can show executives why patch management ranks higher than an AI-driven SOAR purchase, even if the latter sounds more exciting.
After identifying priority gaps, security leaders should use three filters, beyond technical fit, to choose vendors.
1. Integration and consolidation value. Gartner reports that 75 percent of large organizations are pursuing vendor-consolidation strategies because tool sprawl drains analyst time and obscures risk visibility. A vendor solution that eliminates a management console and natively shares telemetry with your existing stack is a stronger choice than a “best-of-breed” widget that stands alone.
2. Operational cost and skills impact. Evaluate deployment complexity, ongoing support needs, and whether your team already knows the product. A cheaper license that requires hard-to-hire expertise will cost more in the first year than a slightly more expensive tool your staff can run tomorrow.
3. Vendor viability and organizational alignment. For regulated industries, stability, clear roadmaps, and data residency are key considerations. Tap peer networks to compare real-world uptime, support quality, and roadmap delivery before signing. Cyber Heat Map helps facilite this with our Cyber Bridge community, enabling you to easily ask for vendor insights from other leaders and consultants.
By filtering candidates through these business-centric lenses, leaders ensure every dollar advances both capability and operational simplicity instead of adding yet another blinking light to the rack.
Start with a “progress scoreboard.” If you don’t have mature telemetry yet, report on milestones like how many projects are complete, on track, or delayed. Pair each item with a one-sentence risk statement so directors see why it matters.
Once foundational work is underway, introduce outcome metrics executives can readily understand. Two that land well are training completion rate (an easy proxy for culture change) and patch latency for critical vulnerabilities.
As tooling matures, graduate to risk-centric indicators: MTTD and MTTR illustrate operational agility, while the percentage of alerts handled through automation shows efficiency gains.
Link these to industry references when possible. IBM’s 2024 Cost of a Data Breach report pegs the average incident at $4.45 million. Even a modest reduction in response time feels tangible when directors can picture seven-figure losses.
Cyber Heat Map streamlines this journey by trending your overall capability score, overlaying each metric with a peer benchmark range. Then you can easily track every improvement against its original funding request in your board presentation.
One common mistake is turning the budget deck into a rolling emergency broadcast. When every audit finding becomes an urgent line-item, directors see a crisis carousel rather than a strategy.
A close second is burying the ask under pages of packet counts and vulnerability IDs. This is the kind of “overly technical explanations” Gartner warns boards will tune out.
Third, some security leaders aim to “solve everything” at once. The request seems limitless, so it gets pared back or ignored.
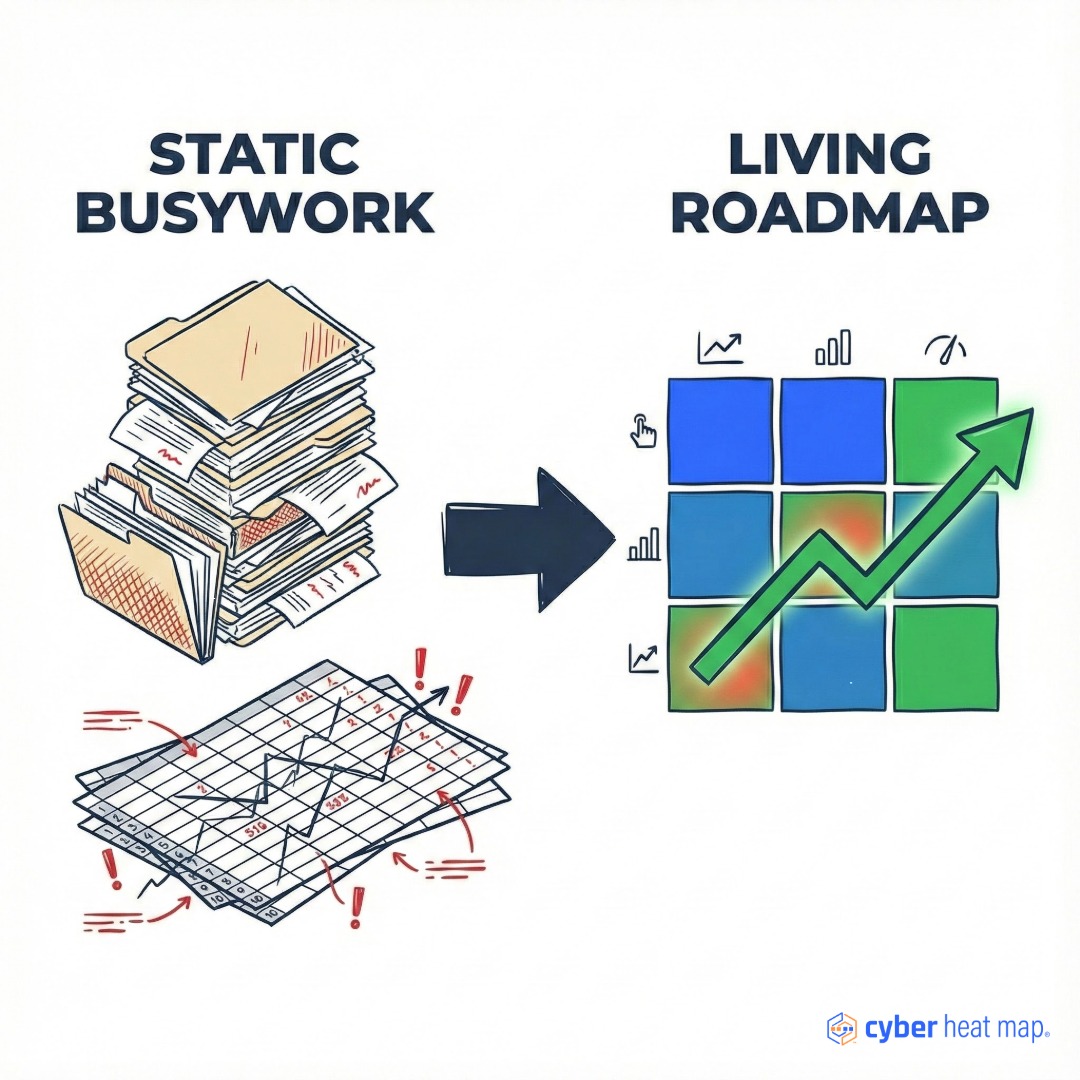
Avoid these traps with a living, data-driven roadmap. Open with how last year’s dollars moved two or three board-relevant metrics, not a laundry list of detections.
Then display your current top gaps ranked by a single, transparent 0-to-100 priority score. This shows you have a method, not a wish list.
Finally, present funding scenarios as "baseline, accelerated, stretch" so directors can choose how fast to retire risk rather than feeling cornered by one big number.
The days of “trust me” cybersecurity budgeting are over. With only 5.7 percent of IT budgets allocated to security and 12 percent of CISOs facing cuts, every dollar must show clear value.
Cyber Heat Map transforms this challenge into an opportunity by benchmarking capabilities against peers, quantifying which weaknesses matter most, and generating an executive-ready roadmap linked to data instead of hype.
This concrete, side-by-side view of risk and spend reframes the conversation from fear to facts, giving security leaders a credible path to invest limited dollars where they create the most resilience.
Christian “Chris” Schreiber is a cybersecurity strategist and architect of the Strategic Operating System for higher education. He helps technology leaders cut through vendor noise and focus their limited resources where they matter most. He is the founder of CampusCISO® and the creator of Cyber Heat Map®, a cybersecurity planning platform used by 140+ technology and information security leaders. Chris previously served as a university CISO and held strategic roles in the private sector. Read more about Chris →
Complete Your Cybersecurity Assessment and Roadmap in Days
Join 30-Day Cyber Strategy Sprint for just $399
Build your own living roadmap in days, not months.
Includes a founder-led kickoff and 30-day access to the Cyber Heat Map® platform and weekly group guidance.
No sales pitch. No contract. Just results.
Secure Your Seat Now
$399 • Limited seats each week